Data Driven Pages I: Building a Basic Map Book
Submitted by geobugThis is Part I of a series on the Data-Driven Pages (DDP) feature in the ArcGIS desktop software suite. Simply put, DDP allows you to make a series of maps from a single mxd file. The functionality was introduced at ArcMap 10, but, to my mind, remains one of the unsung heroes of the software suite. It's a regular part of our departmental workflow at the office to export series of maps for disparate areas, at varying scales, that sometimes even cross projection zones, and that must all have the same symbology. We do it everyday. Bookmarks only get you so far, and maintaining multiple mxds means that when your project manager decides that all lines that represent trails must be purple instead of brown, then that's you opening and editing a dozen different documents, and hoping you don't accidentally click the slightly darker shade of purple in one of them from boredom-induced lethargy.
There's a lot that can be done with data-driven pages right out of the box. If you're willing to roll up your sleeves and play with python a little, there's a lot more that can be done with it. But let's start at the beginning: what it is and how you use it to make a basic map book.
[Note: I crafted the following examples using ArcMap 10.3. This should be compatible with any version of ArcGIS from 10.0 forward, and the process should be comparable to an ArcGIS Pro environment as well.]
Let's take a basic dots-on-a-map approach for starters.
Use Case Scenario: I Need a Beer
So let's say you want to make a series of maps showing the location of each brewery in Yolo County. Noble goal. You have yourself a point feature class with the brewery locations and you've put together a basic mxd with other useful data that you'd like to see on each and every map. Now what?
1) Enable the DDP toolbar
In the Customize menu, choose Toolbars and then select Data Driven Pages from the list. (That was easy.)
2) Set up your DDP.
On your newly-enabled Data Driven Pages toolbar, click the properties button.
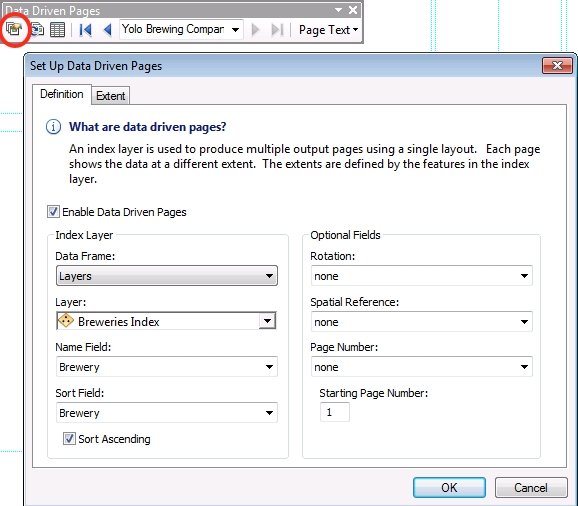
Check the checkbox to turn Data Driven Pages on, set the data frame you want to work in, and under Layer, choose the layer that serves as the index layer for your map book. (In this example, that is our point feature class of brewery locations.) Under Name, choose an attribute field in your index layer that represents the feature is some convenient way. It's helpful if this field contains unique values, although it's not necessary.
Note the optional fields available to you. You can specify a rotation for each page based on an attribute field in your index layer. You can choose to change the coordinate system of your mxd between pages, which is handy if you have a project area that spans UTM zones, for example. Two tips here regarding the spatial reference option:
- You don't have to put the whole long projection string in your attribute table. The EPSG code will suffice.
- If for some reason your data driven pages index is going to switch you between projections using different datums, make sure your transformations are already set up in your mxd. Else-wise, Very Unfortunate Things can happen.
On the Extent tab, you have options regarding how your page will be scaled around your index features. For this example, we're going to use the default, to center around the index feature and maintain whatever the current scale is for your data frame.
Click okay and ArcMap will build your data driven pages map set.
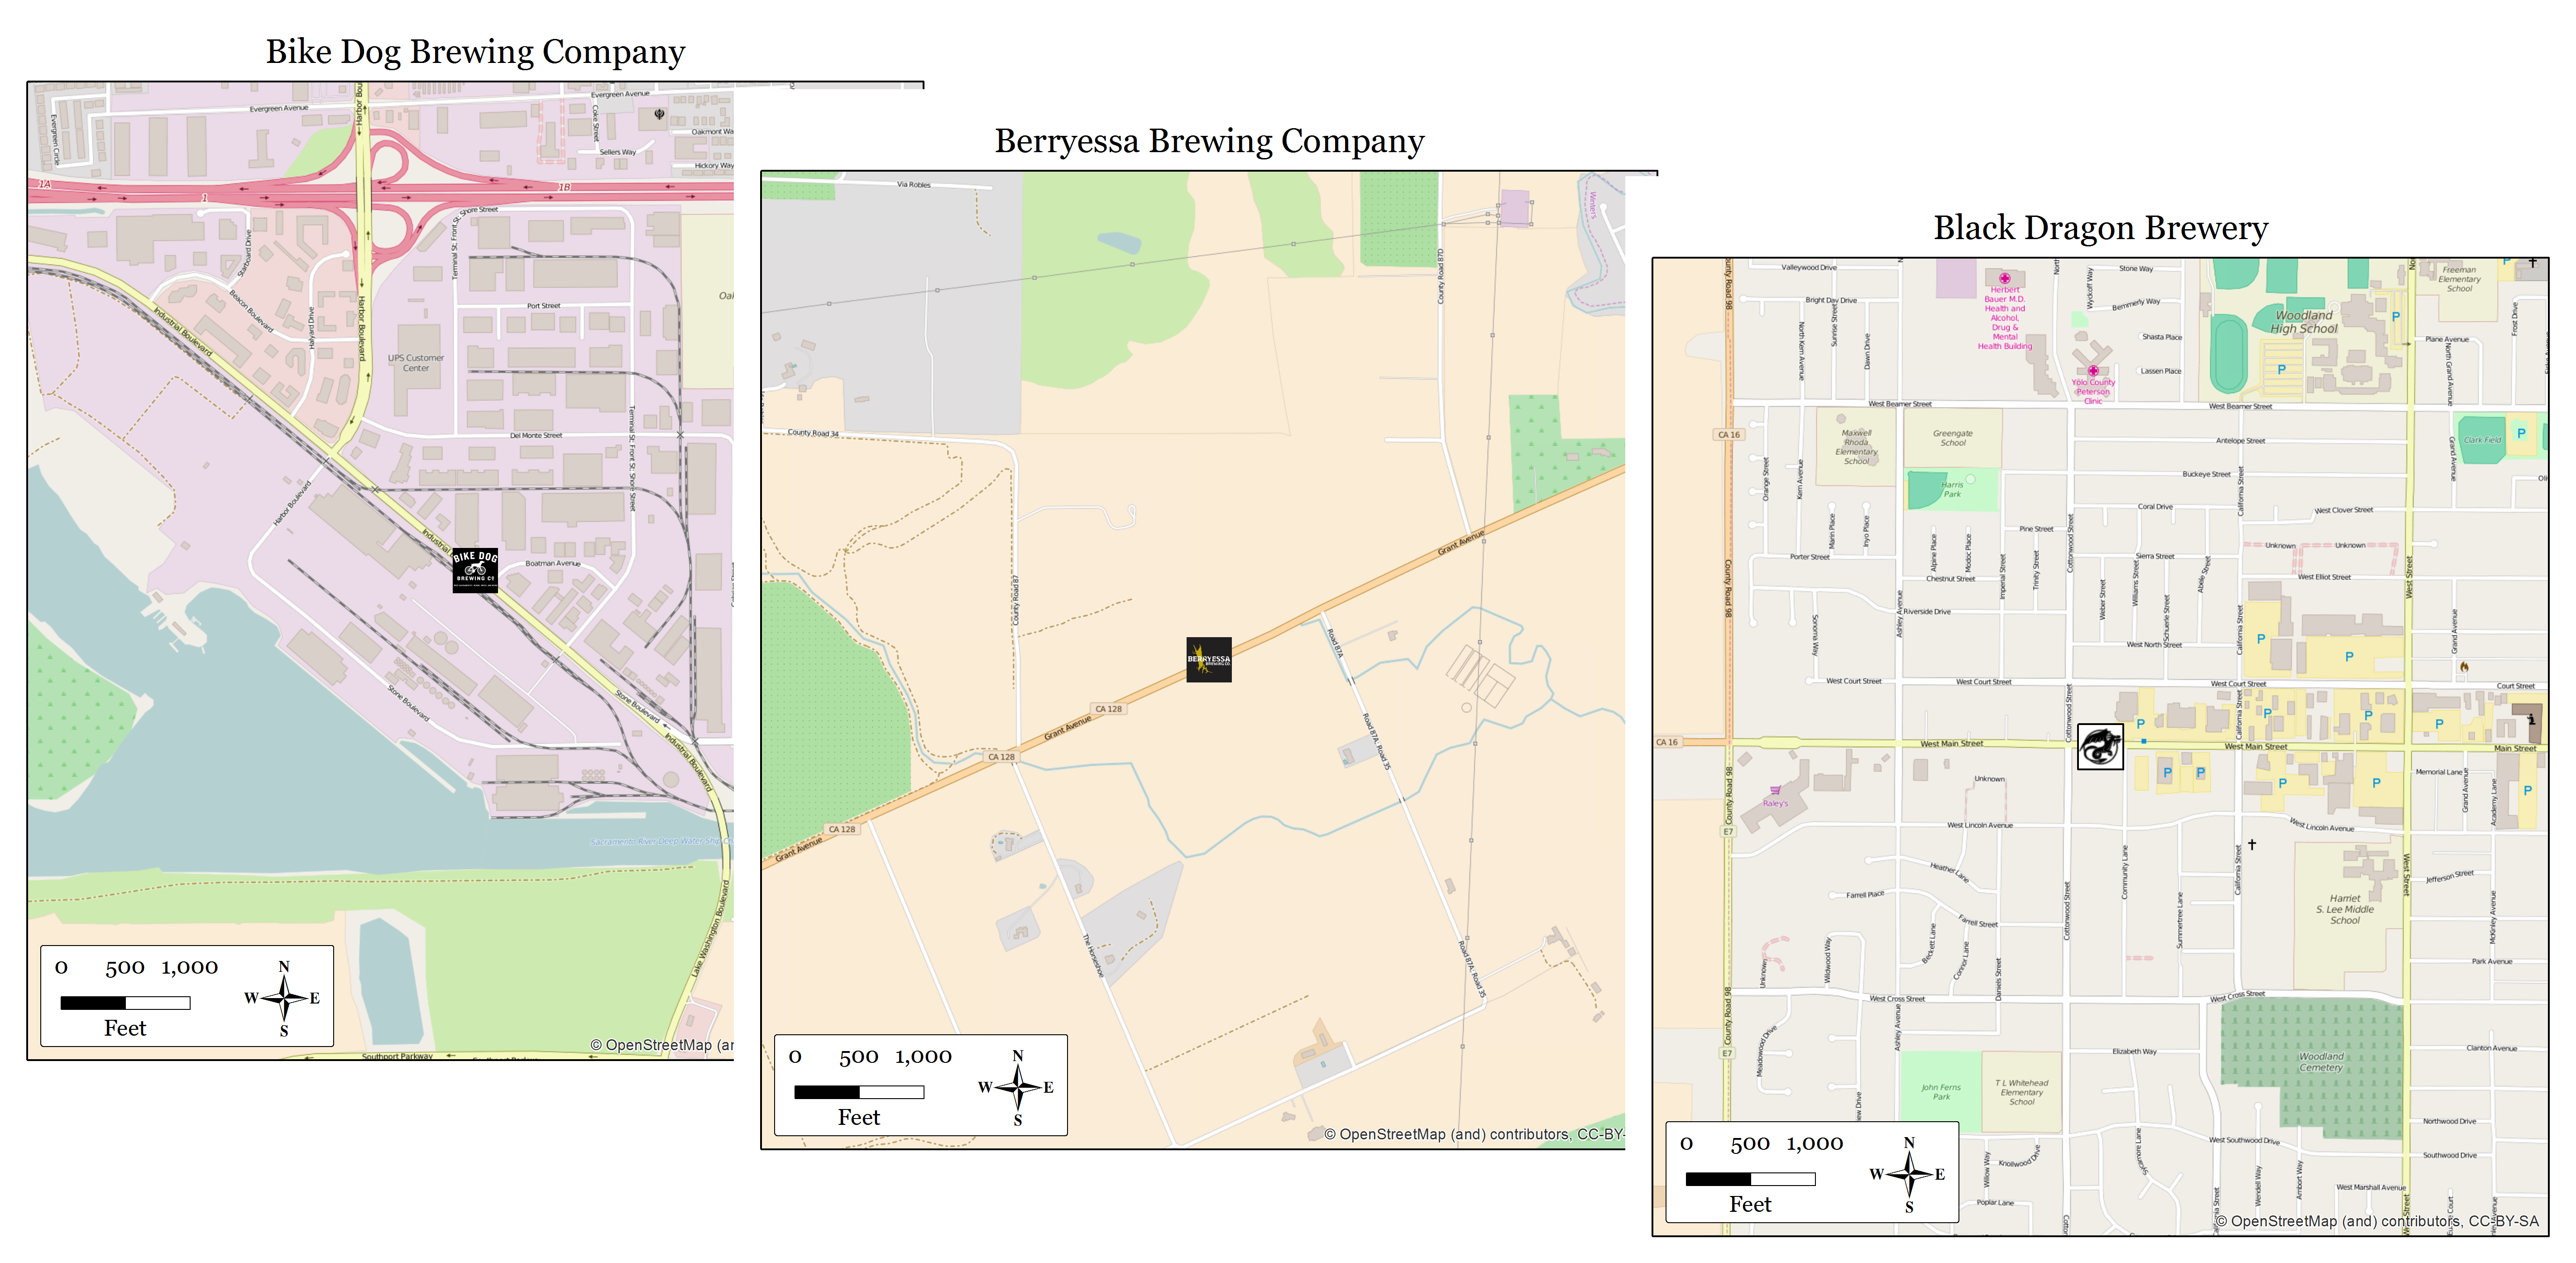
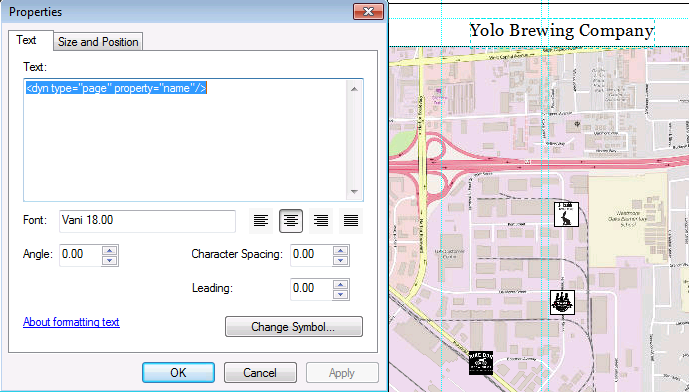
The arrow keys on the DDP toolbar will help you navigate through your new pages. The Page Text menu on the Data Driven Pages toolbar will allow you to add text to your map layout that updates as you cycle through the pages. You can also type this out manually, if you prefer:
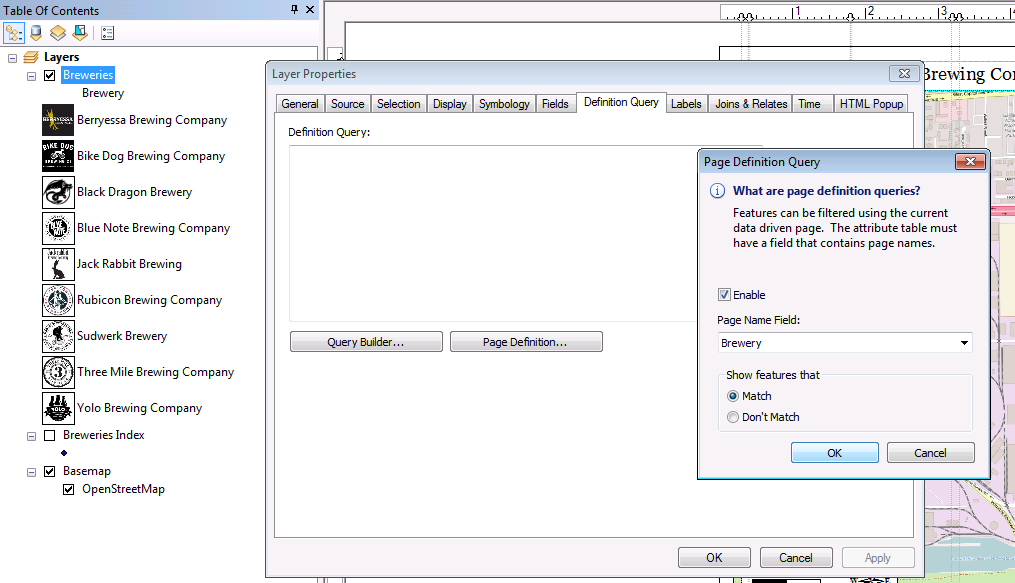
With the introduction of data driven pages came page driven queries. Notice in the image above that because we have three breweries in relative proximity to each other, that they all appear together within the same map frame. For my map set, I want only the brewery that is the focus of the page to show. If you right-click on your layer, go to Properties, and choose the Definition Query tab. There will be a Page Definition button. There's a catch though. You can't set up this kind of query on the layer that running your data driven pages, and in this example, the layer that is symbolizing our breweries in the map series is also our DDP index layer. To get around that, make a copy of that layer in your active data frame, so that we have two layers that both use the same point feature class as a data source. The layer that runs your data driven pages doesn't have to be visible in your map -- it just has to be present -- so name one brewery layer something like "Brewery Index" and uncheck it in the table of contents so it is not visible. Make sure that this is the layer to which your data driven pages is pointed. The remaining copy, called "Breweries" is where we set up the symbology that will be displayed on the map. And because this layer isn't driving our DDP setup, the Page Definition option will be available to you in the definition query options. Enable the page definition query by checking the check box. Select the field that matches the field that you choose for "Name Field" in the DDP properties, and select "Show Features that Match."
The images below show examples of the "Bike Dog Brewery" map. The image on the left shows the map without the page definition query set. The image on the right shows the same map with the page definition query set.
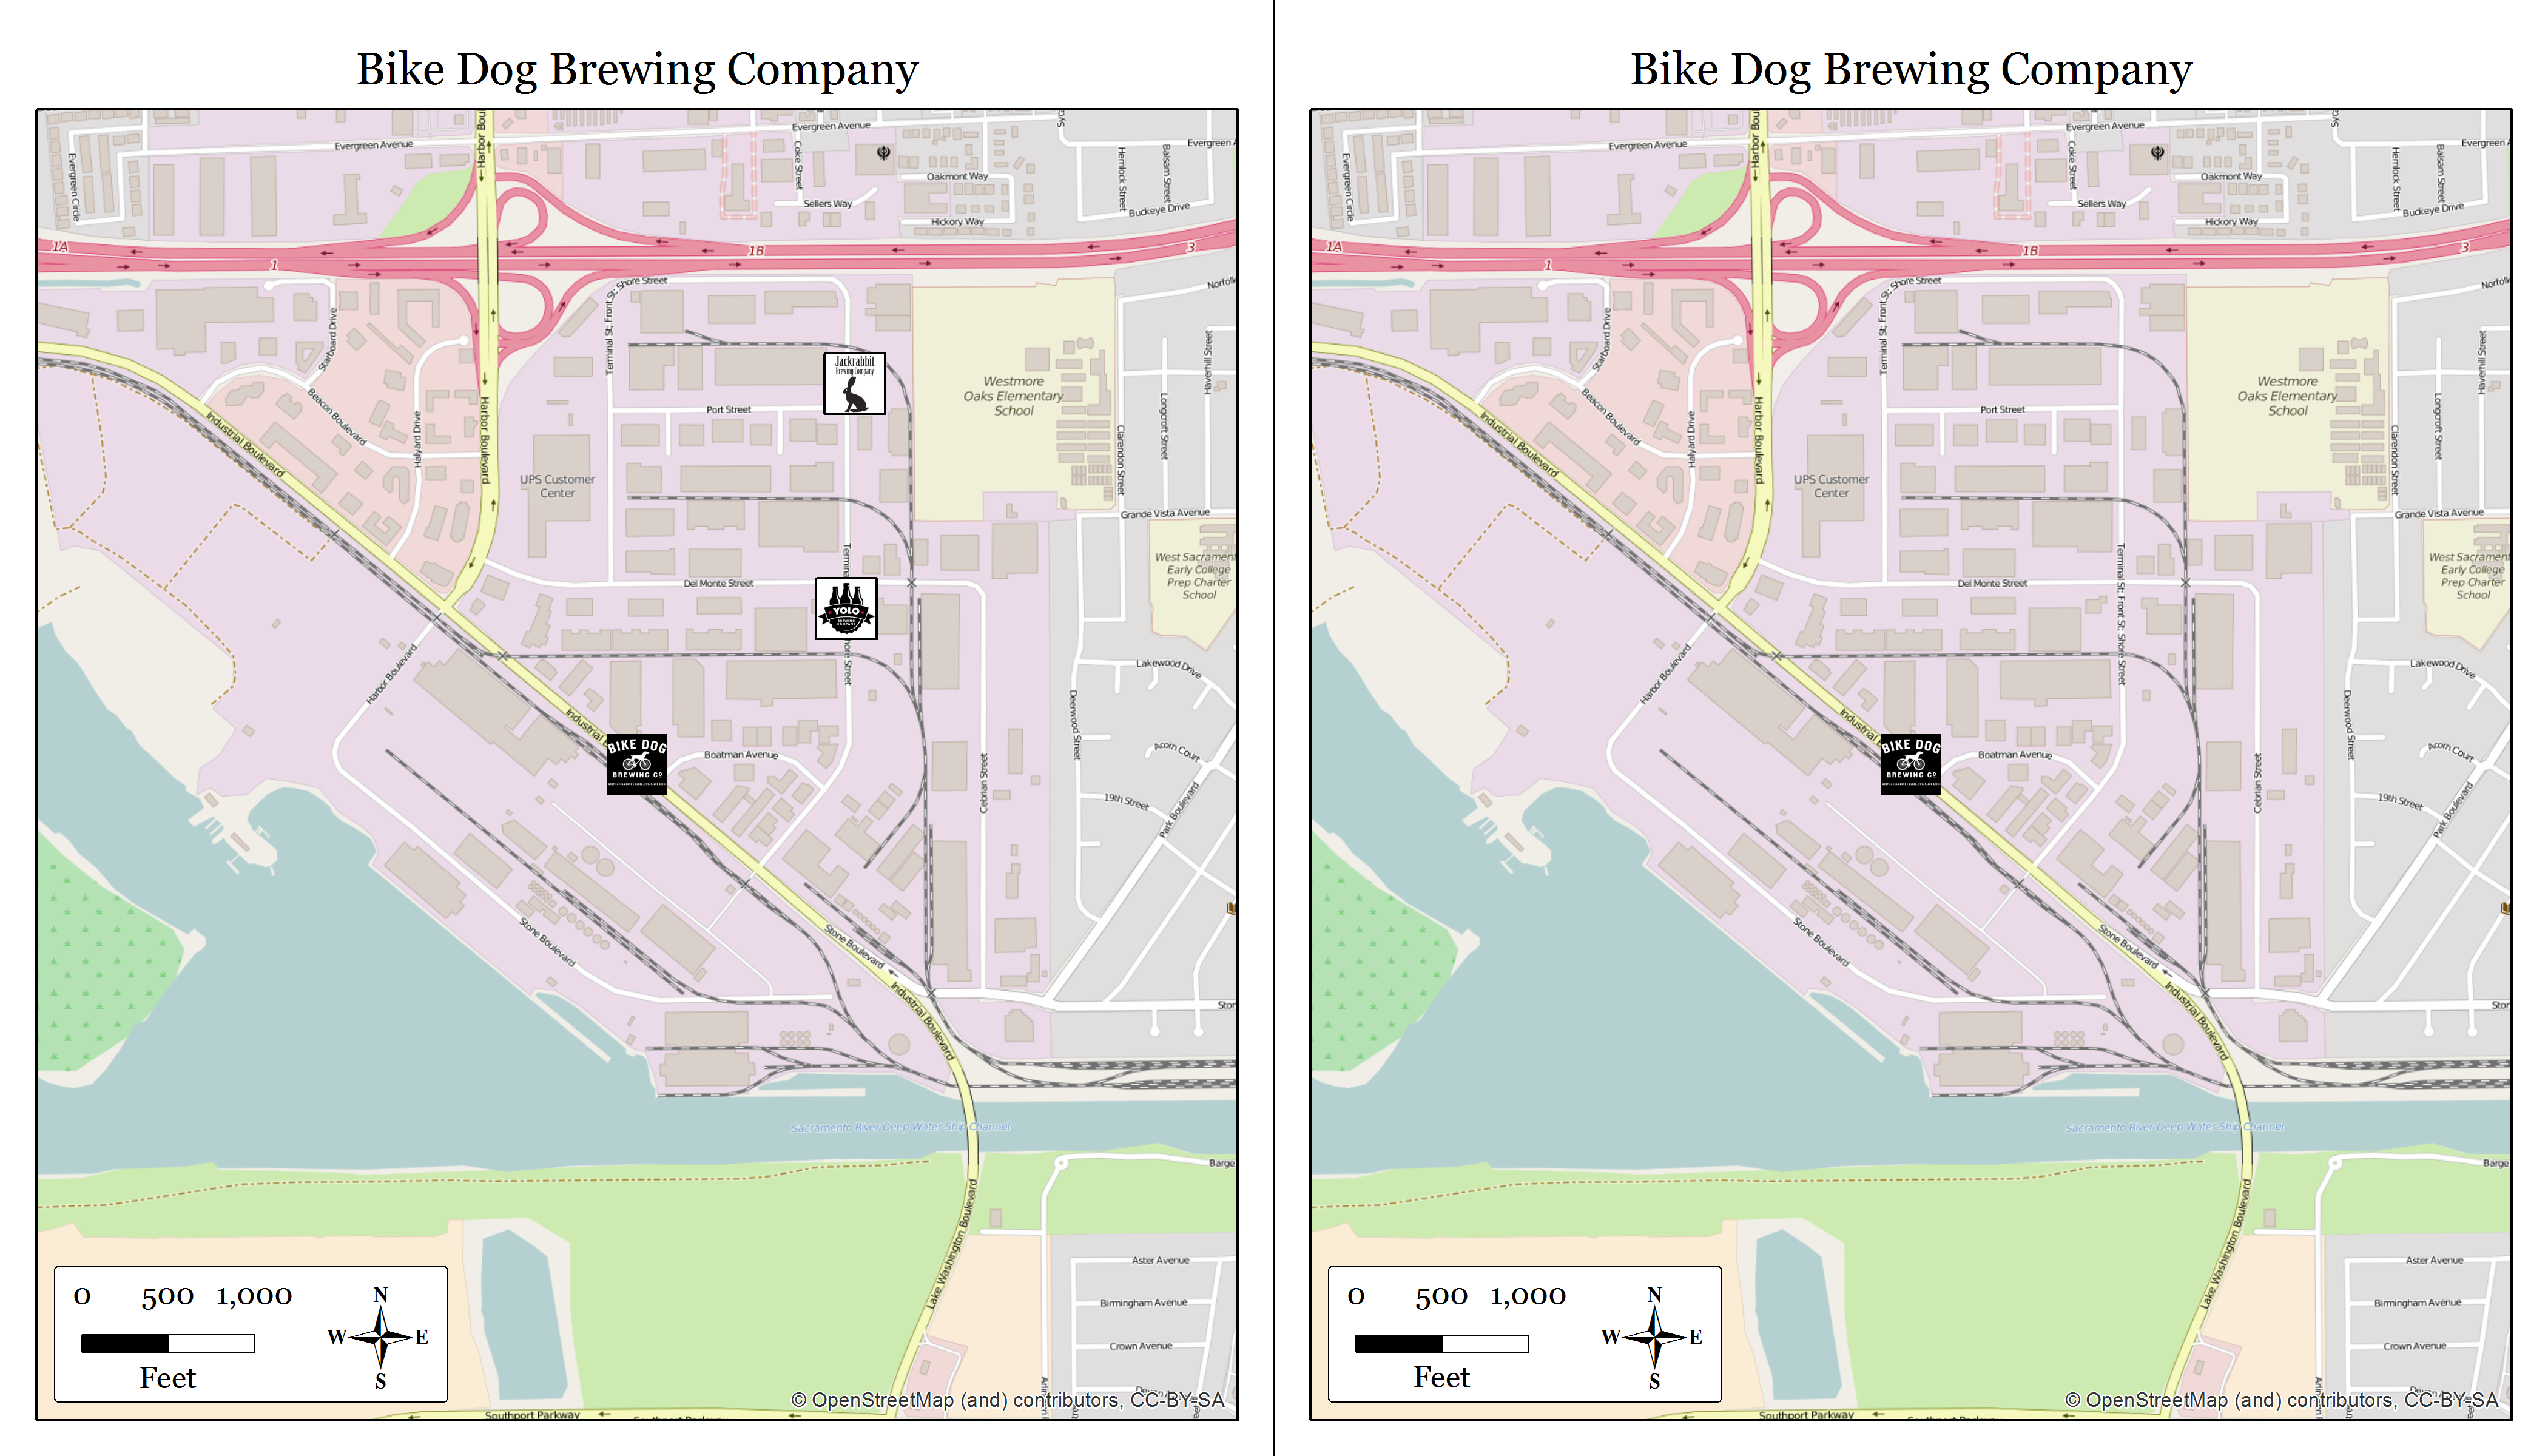
Okay, so now we have nine maps in one mxd. And more importantly, we can find beer.
More articles in this series: