Data Driven Pages IV: Manipulating Layout Elements for use with DDP
Submitted by geobugThis is a bit of an extension on our last conversation regarding exporting data driven pages (DDP), but there's enough to talk about here that I thought it warranted its own post. Let's address how you go about manipulating layout elements with respect to your DDP setup.
Here's a use case scenario. Remember our map book of brewery locations? We were using data driven scale in that example, and that means the scale bar is going to change from page to page. Let's suppose we want some control over the scale bar settings on each page.
If you want your scale bar to stay the same length in page units on the page, there is an option in the scale bar properties to adjust the division value, rather than the length of the bar, as the scale changes. And ArcMap does its best to pick logical units for those division breaks. I often find, however, that I'm a little bit pickier about my scale bars than ArcMap is.
The scale bar is an example of a page layout element. That's something that is present in the page layout view, rather than the data frame view. Other examples would be north arrows, legends, and text elements like map titles.
ArcPy vs. The Layout
When you want to access page layout items with ArcPy, you use the ArcPy mapping module, and there are some limitations you should be aware of. Generally speaking, the mapping module will let you get to a layout element, but not inside a layout element. So you can find an existing scale bar and you can move it around on the page, but you can't create or destroy scale bars, and you can't alter their properties, like units or length.
Its my fondest wish that one day the arcpy.mapping library will be expanded to include hooks into these features. (You too? No way! Why not up-vote the issue on geonet?) Today is not that day, however, so what are our options if we want to alter the scale bar and use python to do it? We can either hit ArcObjects from within the python script, or we can cheat. If you want to read about utilizing ArcObjects in arcpy, it's a frequent topic of discussion on the various GIS-themed forums out there (here's an example). I think it's a bit overkill for our situation here, especially if you're not already uber familiar with ArcObjects. Plus any time you access one programming language from another and an error arises, it's that much harder to run it to ground. So let's cheat; it's more fun.
The accepted workaround for this problem is to have multiple scale bars in your mxd, stashed off to the side of the page extent, and use your python script to call the one you want over when you want it. It's like a big arcpy version of Red Rover Red Rover. It's not neccessarily eloquent, but it's highly functional and easy to implement, so let's talk a look.
Exporting Specific Scale Bars with your DDP
- Name your scale bars
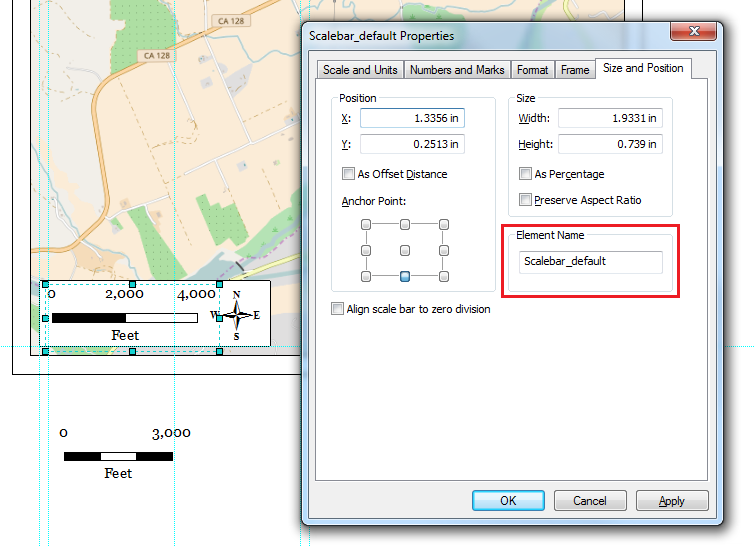
Make as many scale bars as you need for your given DDP set in your mxd. To name them, right-click on the scale bar, choose Properties, and specify an element name on the size and position tab. Give them names that are similar but distinct. In this example, we're using "Scalebar_default" and "Scalebar_thirds". Because they start the same way, it will be easy for arcpy to grab them as a list in a few minutes when we're ready to roll. While you're looking at the properties, make note of the x and y values for the position of the scale bar on the page too; we'll need that for later.
- Update your attribute table
In your index feature class, open up the attribute and add a text field called something snazzy like "ScaleBar". Populate this field with the name of the scale bar you would like to use for each page.

- Modify your code
We're going to alter that same export code we used in the last article on exporting to include a little bit about moving the scale bars. Our code is going to make a list of all the layout elements called something like "Scalebar_*". Then, when it iterates through each page, it's going to grab the scale bar name we put in the attribute table and look at the scale bars in the list. If the attribute table row value matches the scale bar name, it will move it to the x and y position we chose in the lower left corner of our map. (Remember that x and y position from the scale bar properties I told you to remember? They go on lines 23 and 24 of the code example below.) All the remaining scale bars will be moved off the page, then out script will export the map by page name, go to the next page and do it all again.
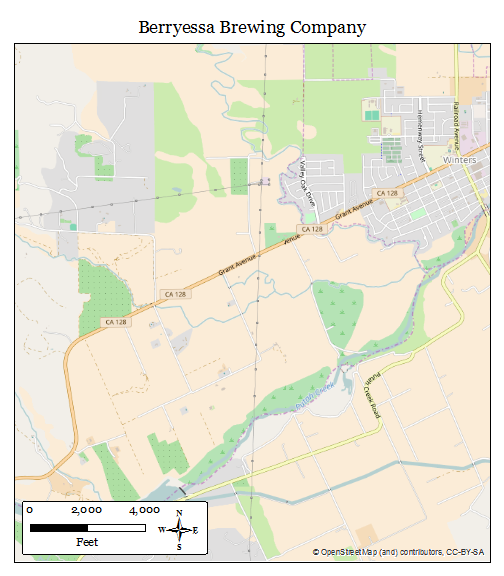
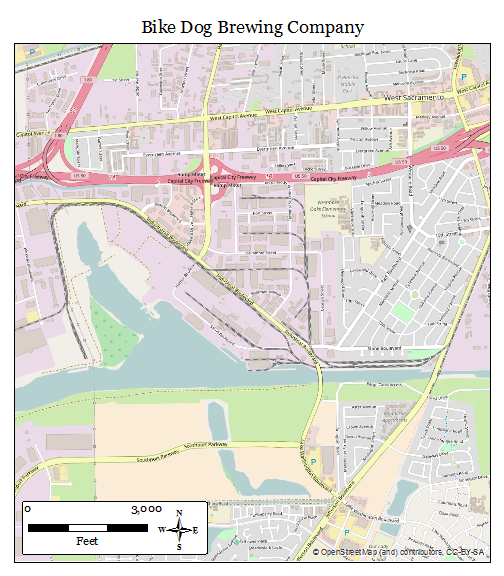
So here are our exported maps with the scale bars we chose:
The punch line here is that even if it's not in the official list of DDP's super powers, that doesn't mean it can't be done. Same goes with arcpy. Sometimes you just have to think outside the box... or outside the page layout. (Just wait until next time when we get into scale-dependent measured grids.)
Other articles in this series:
- Data Driven Pages I: Building a Basic Map Book
- Data Driven Pages II: The Importance of a Good Index Layer
- Data Driven Pages III: Printing and Exporting Tips
- Data Driven Pages IV: Manipulating Layout Elements for use with DDP
- Data Driven Pages V: UTM Grids for Multiple Scales
Comments
Thank you very much for this
Hey Marta. Thanks for
Thank you very much for this
Hi Jason. If the code samples